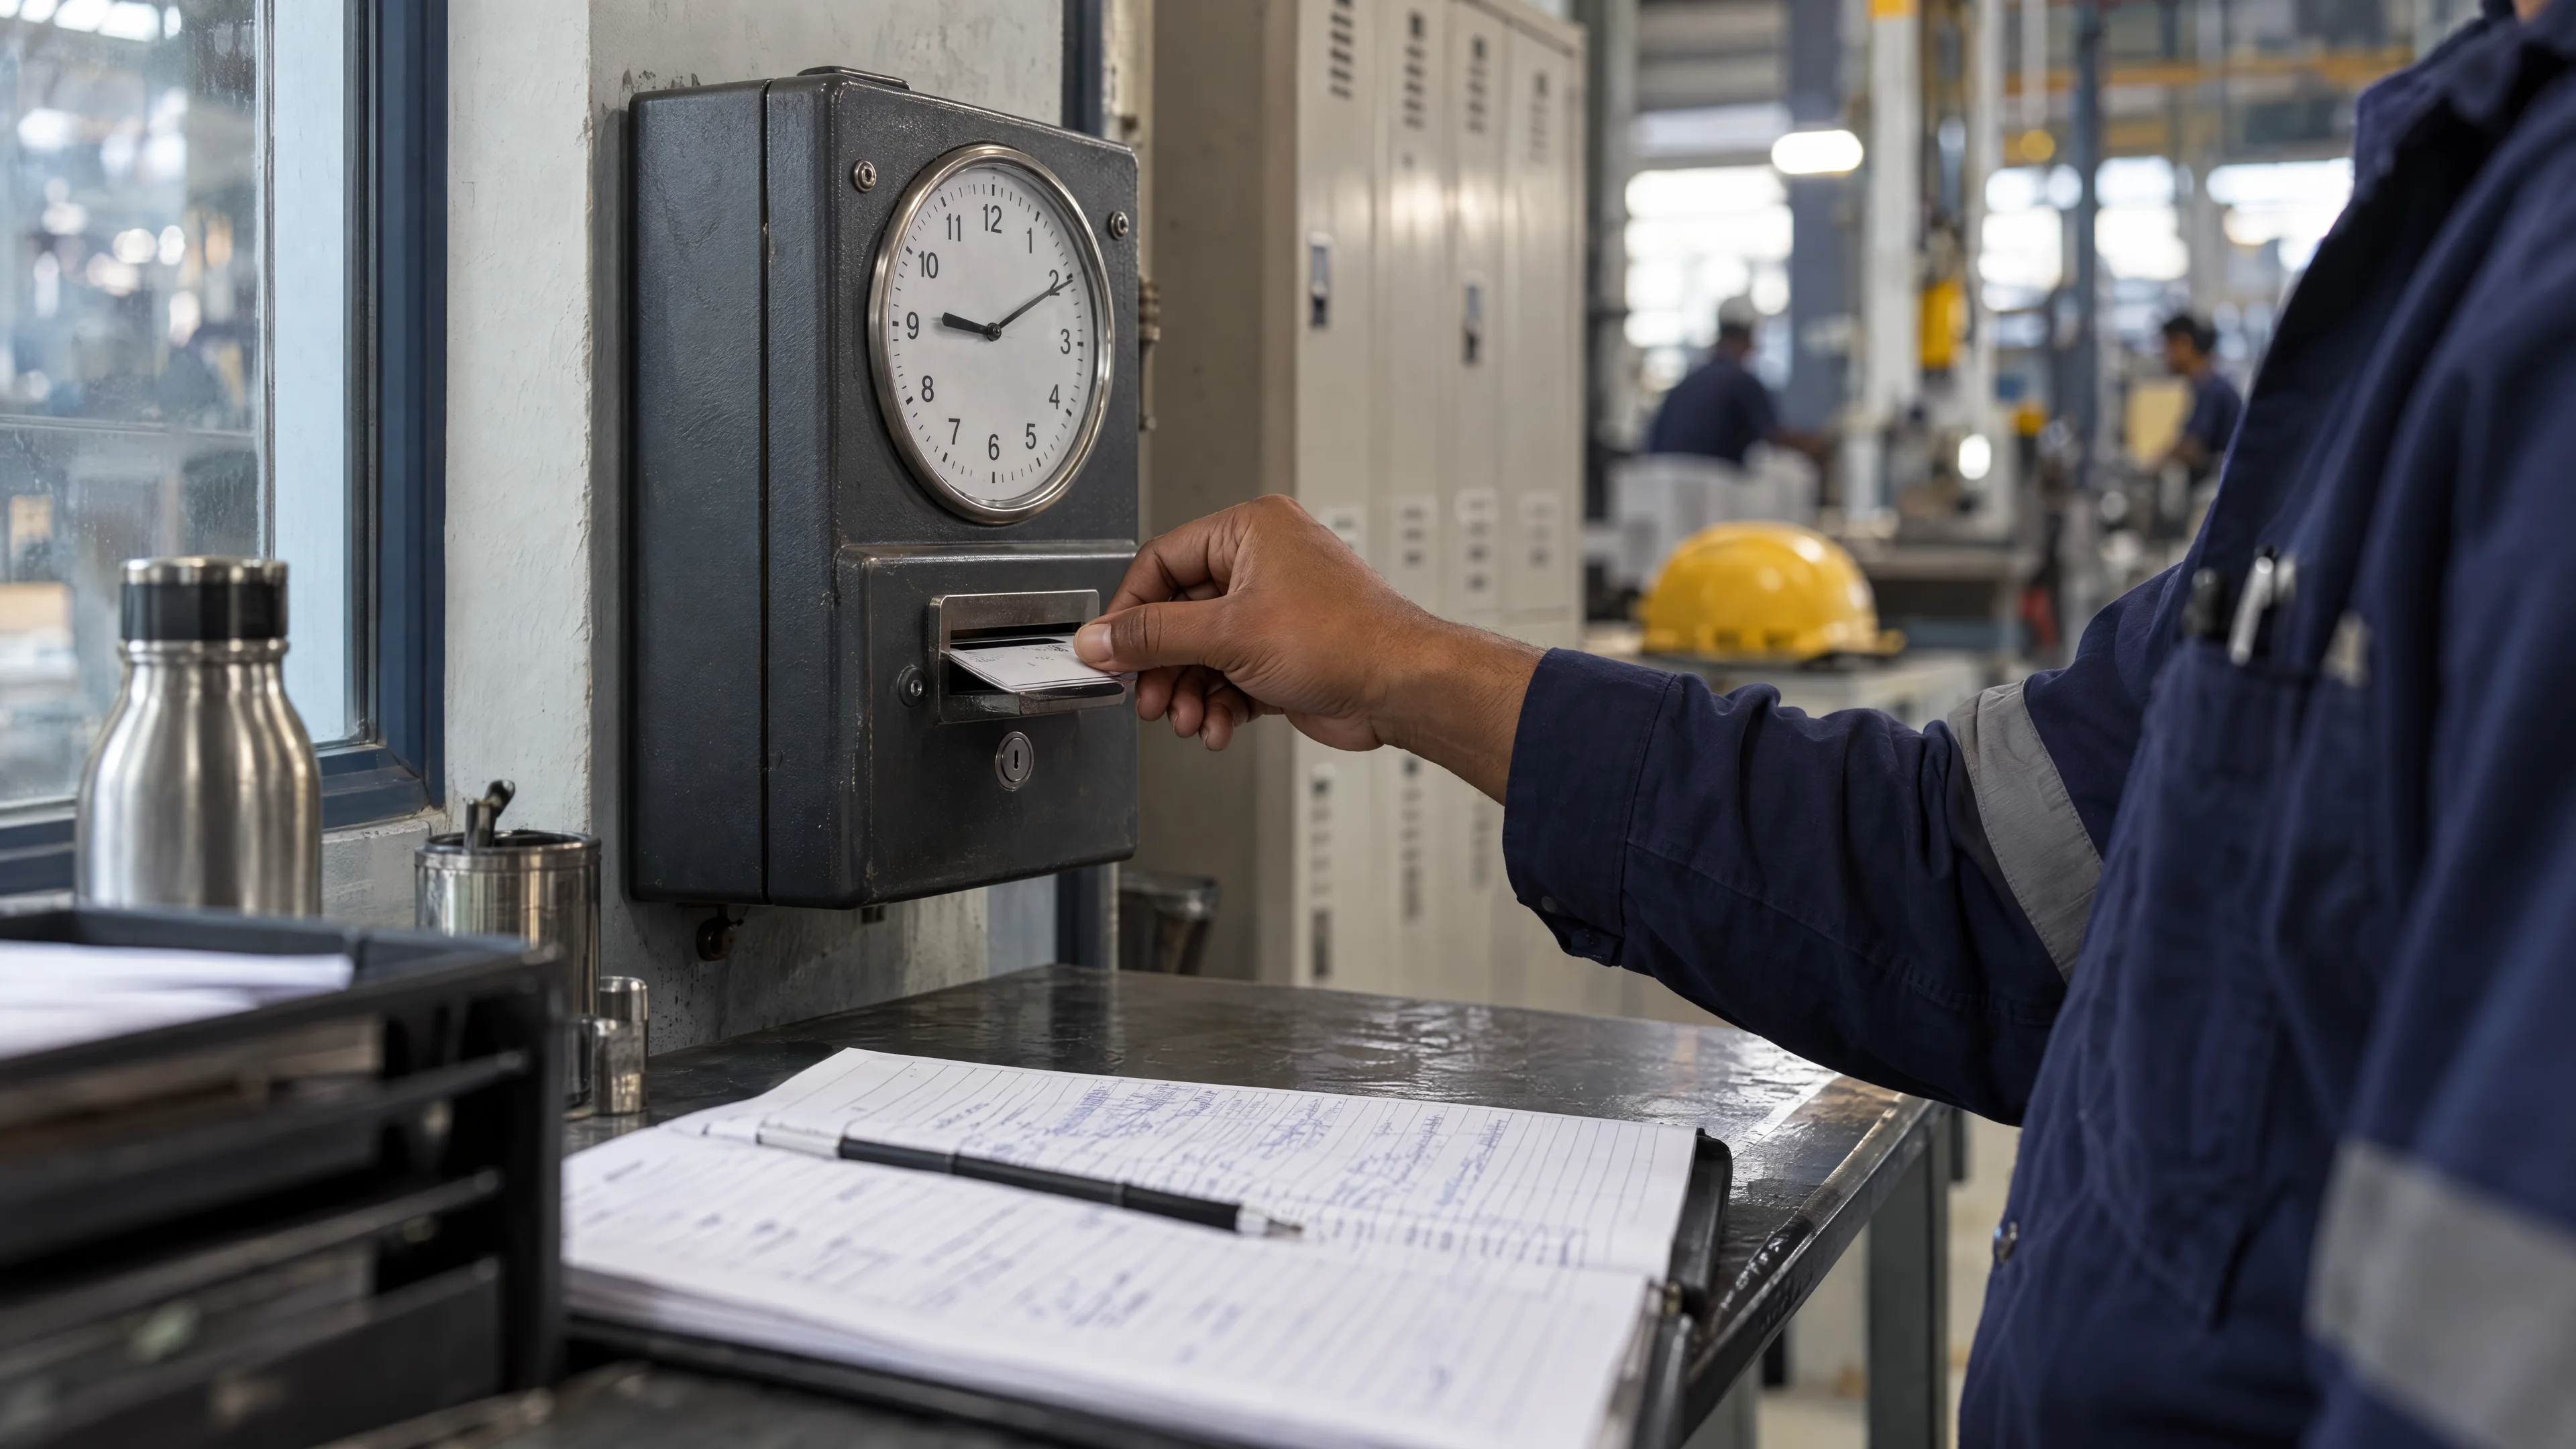
Operational performance is a sequence of events, queues and handoffs. A monthly total can describe completed work while concealing the age of unfinished work or the concentration of exceptions in one location. Effective intelligence connects aggregate performance with the process that produced it.
Covorg’s business operations applications include KPI monitoring, process analysis and anomaly detection. This approach organises those capabilities around process identities, event timing, service expectations and clear ownership of the actions that follow.
Define the process instance and its events
Identify what moves through the process: an order, a service request, a work item or a production batch. Assign a stable process identity and define the events that mark meaningful transitions. Record event time, location, responsible function and relevant status.
Distinguish a change event from a repeated observation. A sensor reading every minute does not represent a new process transition every minute. Combining these data forms requires an explicit relationship between the observation, the asset and the process interval it describes.
Balance completed work with work still in progress
Throughput measures completed work over a period. Queue size measures work waiting at a point in time. Cycle duration depends on defined start and end events. Each reveals a different aspect of performance, so choose a small set that supports the actual operational decisions.
| Measure | Definition to agree | Useful investigation |
|---|---|---|
| Throughput | Eligible completions during a period | Changes by location, team or work type |
| Queue age | Elapsed time since entry for open work | Oldest unresolved items and priority |
| Cycle duration | Time between agreed process boundaries | Waiting time versus active processing |
| Rework | Repeated work under a defined rule | Recurring exception categories |
| Service attainment | Eligible items meeting the agreed target | Exclusions and calendar assumptions |
Account for gaps in operational signals
Missing or delayed events can make a process appear stalled. Monitor the source’s expected arrival pattern and distinguish communication failure from genuine inactivity. A last observed state should carry its observation time so users can judge whether it remains useful.
Where several systems contribute events, agree the clock and ordering assumptions. An event arriving later may describe an earlier occurrence. Reconstructing a process therefore needs explicit rules for late information, duplicate identities and conflicting updates rather than relying on arrival order alone.
Connect exceptions to a response process
Define the conditions that require attention, the team responsible and the information needed for triage. A queue exception might include item age, promised date, priority and related availability. An anomaly score without this context leaves the operational team to rebuild the investigation.
Track acknowledgement, disposition and resolution separately. An acknowledged alert is not necessarily a resolved business issue. Reviewing outcomes can reveal noisy thresholds, recurring source problems or process changes that would prevent the same exception from returning.
Example service process review
- 01
Observe
Collect process transitions and relevant operational measurements.
- 02
Reconstruct
Associate events with process instances and resolve timing exceptions.
- 03
Prioritise
Evaluate queue age, service expectations and business importance.
- 04
Improve
Review resolved cases to identify recurring constraints and data issues.
Design considerations
- Document business calendars and pause rules before comparing service durations.
- Include unfinished work when reviewing process performance.
- Separate an absent operational event from evidence that no activity occurred.
Sources
The following sources explain the underlying technical patterns.